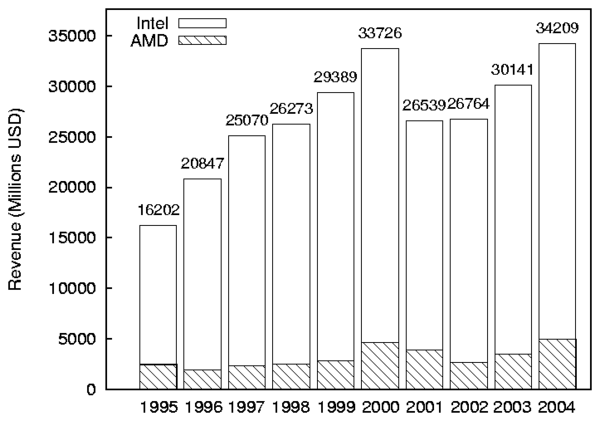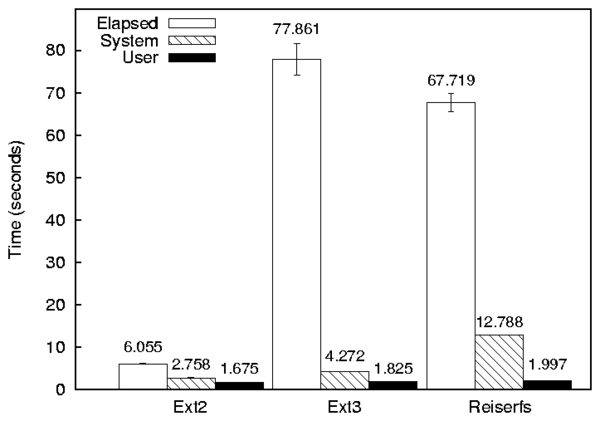
Figure 8.1: A bar graph with three series (Ext2, Ext3, and Reiserfs) and three components (Elapsed, System, and User).
The Auto-pilot Benchmarking Suite For version 2.1, 25 July 2005.
Copyright © 2005 Charles P. Wright
Copyright © 2005 Erez Zadok
Copyright © 2005 Stony Brook University
Copyright © 2005 The Research Foundation of SUNY
All Rights Reserved.
Permission to copy this document, or any portion of it, as
necessary for use of this software is granted provided this
copyright notice and statement of permission are included.
THIS SOFTWARE IS PROVIDED BY THE REGENTS AND CONTRIBUTORS “AS IS” AND
ANY EXPRESS OR IMPLIED WARRANTIES, INCLUDING, BUT NOT LIMITED TO, THE
IMPLIED WARRANTIES OF MERCHANTABILITY AND FITNESS FOR A PARTICULAR PURPOSE
ARE DISCLAIMED. IN NO EVENT SHALL THE REGENTS OR CONTRIBUTORS BE LIABLE
FOR ANY DIRECT, INDIRECT, INCIDENTAL, SPECIAL, EXEMPLARY, OR CONSEQUENTIAL
DAMAGES (INCLUDING, BUT NOT LIMITED TO, PROCUREMENT OF SUBSTITUTE GOODS
OR SERVICES; LOSS OF USE, DATA, OR PROFITS; OR BUSINESS INTERRUPTION)
HOWEVER CAUSED AND ON ANY THEORY OF LIABILITY, WHETHER IN CONTRACT, STRICT
LIABILITY, OR TORT (INCLUDING NEGLIGENCE OR OTHERWISE) ARISING IN ANY WAY
OUT OF THE USE OF THIS SOFTWARE, EVEN IF ADVISED OF THE POSSIBILITY OF
SUCH DAMAGE.
Running a benchmark in Auto-pilot requires the following four steps:
The rest of this manual is roughly divided into sections that correspond to these actions. Configurations describes the Auto-pilot configuration language. Scripts describes the scripts and hooks that are included in the Auto-pilot distribution and Custom Scripts describes how to write your own scripts. Getstats describes how to use and customize Getstats and Graphit describes how to use our plotting tool.
This chapter describes the Auto-pilot configuration syntax. Auto-pilot configurations are much like programs, in that they support some simple loops and setting variables.
Comments start with a pound sign (#) and are terminated by the end of
line. Blank lines and initial spaces are ignored. Auto-pilot supports
two types of variable substitution: internal variables and environment
variables. Before executing a line of the script %VAR% is
replaced with the value of the internal variable VAR and
$VAR$ is replaced with the value of the environment variable
VAR.
First we describe each directive in Directive Reference. Next, we present an example configuration used by Postmark in Configuration Example.
INCLUDE FILEOPTINCLUDE FILEINCLUDE and OPTINCLUDE insert FILE into the current
Auto-pilot configuration. If the file does not exist, then
INCLUDE causes the script to fail, whereas OPTINCLUDE does
not raise any errors. OPTINCLUDE is useful to allow users to
define optional local settings.
Auto-pilot first reads the entire configuration, then processes it. This
means that you can not use variable substitution within INCLUDE
or OPTINCLUDE.
INCLUDEPATH PATHINCLUDE files.
Auto-pilot first reads the entire configuration, then processes it. This
means that you can not use variable substitution within
INCLUDEPATH.
ECHO STRINGVAR VAR=VALVAREX VAR=VALVAREX is the same, but VAL is first passed to
Perl's eval function.
ENV VAR=VALENVEX VAR=VALENVEX is the same, but VAL is first passed to
Perl's eval function.
FOREACH VAR VAL1 [VAL2 ... VALN]DONE is reached. Not ending the loop with a DONE statement results in an error. VAR is then set to
VAL2, and the directives are executed again. This process
repeats until VALN is reached. Each value is separated by one
or more whitespace characters.
FOR VAR=BEGIN TO END [FACTOR M|ADD I]DONE is reached. Not ending the loop with a DONE statement results in an error. VAR is then updated and the directives are
executed until VAR reaches END. If FACTOR is specified,
then VAR is multiplied by M after each iteration. If ADD
is specified then VAR is incremented by I after each iteration.
If neither FACTOR nor ADD is specified, then VAR is
incremented by one.
IF VAR OP VALOP can "=", ">", "<", "<=", or ">=". A "!"
before the operator negates the result of the comparison. Only "="
and "!=" can be used with strings. For more complicated conditions you can use
VAREX, which sets a variable to an evaluated Perl expression. For example, if you wanted to test a complex condition such as a regular expression, you could use the following code:
          VAREX SCSI=if ("%TESTDEV%" =~ /sd.[0-9]$/) \
              { return 1; } else { return 0; }
          IF SCSI=1
                  ECHO %TESTDEV% is a SCSI device.
          ELSE
                  ECHO %TESTDEV% is not a SCSI device.
          FI
If the condition evaluates to true, then Auto-pilot executes all lines
until an ELSE or a FI. If there is an optional
ELSE block, then the code between ELSE and FI is only executed if
the condition was false. Auto-pilot also supports an arbitrary number of
ELSE IF blocks, with the expected semantics. For example:
          IF FOO = 0
                  ECHO Foo is zero.
          ELSE IF FOO < 0
                  ECHO Foo is negative.
          ELSE
                  ECHO Foo is positive.
          FOO
WHILE VAR OP VALWHILE repeatedly executes all directives until the corresponding
DONE, as long as the condition remains true. Not ending the loop with a DONE statement results in an error. See IF for a
description of valid conditions.
RESULTS=PATHTEST directive.
LOGS=PATHRESULTS, PATH must be a
directory that already exists, and the file names within this directory
are determined by the NAME in the TEST directive.
THREADS=NTHREADS directive instructs Auto-pilot to create N
processes when running a benchmark. Each process executes the same
command, but they each have a different value for the environment
variable APTHREAD (ranging from 1 to N). By using the value of
APTHREAD, each process can perform a slightly different action
(e.g., use separate test directories or thread 1 may execute the server
while thread 2 executes a client).
Semaphores are used to synchronize the start of multi-threaded benchmarks. Before executing a benchmark, a semaphore is set to the number of threads that will be executed. The semaphore's key is stored in the environment variable APIPCKEY. Using the semdec utility, this semaphore can be decremented by each of the threads. semdec then blocks until the semaphore reaches zero.
CHECKPOINT FILEAfter checkpoint executes, the value of the Auto-pilot variable
RESTORE is "0", but after resuming from the checkpoint the value of
RESTORE "1". This can be thought of like the return value of
Unix's fork system call. For example, if RESTORE is 0,
then your configuration could reboot the system, but it should not
reboot the system after restoration (because it should continue running
benchmarks).
TEST NAME EPOCHS [INCREMENT PREDICATE]TEST directive begins a benchmark description, which is ended
by a corresponding DONE directive. Not ending the loop with a DONE statement results in an error. Each benchmark can have
several additional directives between the TEST and DONE,
including control structures (e.g., IF) and benchmark scripts.
TEST directives can not be nested.
Log and results files are saved to a file, which has a name derived from
the benchmark NAME. If NAME is /dev/null, then
both the results and log file are discarded. If NAME is any
other name that begins with a slash, then the absolute path is used, but
the results are stored in NAME.res and the
stdout/stderr streams are stored in NAME.log.
Finally, if the name does not begin with a slash, then the directories
previously specified by RESULTS and LOGS are prepended to
the results and log file name, respectively. For example, if the
results directory is /home/cwright/results and the NAME is
"ext2:1", the results are stored in
/home/cwright/results/ext2:1.res.
EPOCHS specifies the minimum number of iterations to run the
benchmark. If no additional arguments are specified, then the benchmark
runs exactly EPOCHS times. INCREMENT and
PREDICATE must be specified together, and control how many
additional times the benchmark should be run. After running the
benchmark EPOCH times, Auto-pilot runs the script
PREDICATE with an argument of its results file each additional
INCREMENT iterations. If predicate returns true (an exit-code of
zero), then the benchmark is finished. Otherwise, the benchmark is run
INCREMENT more times, and the predicate is checked again.
See Getstats, for information on using Getstats to evaluate
predicates based on the results.
SETUP SCRIPTCLEANUP SCRIPTPRESETUP SCRIPTPOSTCLEANUP SCRIPTEXEC SCRIPTTEST directive can
include any number of EXEC, SETUP, CLEANUP,
PRESETUP, and POSTCLEANUP scripts. EXEC is the
simplest one, and the script it specifies is run for each iteration of
the test. EXEC should be used for the actual processes that are
being measured. If THREADS has been specified, EXEC
spawns multiple threads.
SETUP is also run for each iteration of the test, but should be
used for scripts that prepare the test environment (e.g, mounting file
systems and clearing the cache). CLEANUP is the complement of
SETUP. It is also run for each iteration of the test, but should
be used to restore the test environment to a "clean" state (e.g.,
unmounting test file systems). Only one instance of SETUP and
CLEANUP scripts are run at a time, even if THREADS has
been set.
PRESETUP and POSTCLEANUP are similar to SETUP and
CLEANUP, but they are only run once per TEST directive.
PRESETUP only runs on the first epoch, and POSTCLEANUP
runs only after the last epoch. These directives can be used for more
global setup and cleanup procedures that need not be repeated for each
iteration of a benchmark (e.g., creating a data set that is used by each
iteration of a read-only benchmark). Only one instance of
PRESETUP and POSTCLEANUP scripts are run at a time, even
if THREADS has been set.
QUIETQUIET (true|false)QUIET to true prevents benchmarks from sending
output to stdout, but still sends the output to a log file. If
neither true or false is specified after QUIET, then it is sent
to true. This option can prevent "noisy" benchmarks from being
artificially slowed due to lots of information being sent to the monitor
(or network).
FASTFAILFASTFAIL SCRIPTFASTFAIL causes Auto-pilot to immediately abort if a single
benchmark run fails. By default, Auto-pilot continues running the next
iteration of the benchmark (or if all iterations are complete, moves on
to the next directive). The optional SCRIPT parameter tells
Auto-pilot to additionally run a script (e.g., to send you an email or
page informing you of the failure).
EVAL PERLPERL.
STOPSYSTEM PROGRAMPROGRAM. The return code is stored in the
Auto-pilot variable RETURN.
The following configuration executes a multi-threaded Postmark benchmark, and is included in the distribution as postmark.ap:
1  #!/usr/bin/perl /usr/local/bin/auto-pilot
2  #
3  # Package: auto-pilot
4  # Erez Zadok <ezk@cs.sunysb.edu>
5  # Charles P. Wright <cwright@cs.sunysb.edu>
6  # Copyright (c) 2001-2005 Stony Brook University
7
8  # What is the name of this test?  Auto-pilot doesn't internally
9  # use it for Postmark, but we may want it for setting paths, etc.
10 VAR BENCH=postmark
11
12 # How many times do we run it?
13 #  We could for example, run it ten times
14 #   VAR TERMINATE=10
15 #  However, it is more interesting to run it five times, then run
16 #  getstats to check if the half-width of our confidence intervals
17 #  are less than 5% of the mean for elapsed, user, and system time.
18 #  We also don't want it to run away and run more than 30 times on us.
19 VAR TERMINATE=10 1 getstats --predicate \
20 '("$name" ne "User" && "$name" ne "System" && "$name" ne "Elapsed") || \
21 ("$delta" < 0.05 * $mean) || ($count > 30)' --
22
23 # How many threads should we go up to?
24 VAR NTHREADS=32
25
26 # What file systems do we want to test?
27 VAR TESTFS=ext2 ext3 reiserfs
28
29 # Include common.inc.  You can override variables and include your own
30 # commands by creating local.inc, which is automatically included by
31 # common.inc.
32 INCLUDE common.inc
33
34 # Do the actual tests
35 FOREACH FS %TESTFS%
36 	FOR THREADCOUNT=1 TO %NTHREADS% FACTOR 2
37 		THREADS=%THREADCOUNT%
38
39 		TEST %FS%-%THREADS%	%TERMINATE%
40 			SETUP fs-setup.sh %FS%
41 			EXEC postmark.sh
42 			CLEANUP fs-cleanup.sh %FS%
43 		DONE
44 	DONE
45 DONE
46
47 # All done
48 INCLUDE ok.inc
Line 1 informs the OS to use Perl as the interpreter for this Auto-pilot configuration. Only one level of interpreter is allowed, so you must execute Perl with Auto-pilot's path as the argument, because Auto-pilot itself uses an interpreter. Auto-pilot uses the pound sign (#) as a comment symbol, and any text after a pound sign is ignored. Lines 3–6 are comments containing copyright notice. Blank lines are ignored.
Line 10 assigns the value postmark to the
variable bench. This variable is not directly used by this
configuration file, but later on we will use it to chose where to store
the Auto-pilot results.
Lines 12–19
set a variable named TERMINATE, which is used later in the configuration
to determine at what point a TEST should end. The simplest method is to
specify a fixed number of tests (e.g., VAR TERMINATE=10).
A more powerful method is to run a predicate command. In this example,
we execute the test at least ten times. For each iteration (denoted by
the "1" in the variable), we execute a predicate. To execute the
predicate after every other iteration, we would replace the "1" with a
"2". It can be useful to run the predicate only after several runs, so
that computing the predicate does not use more time than the benchmark
itself.
In this case we execute the command getstats --predicate '("$name"
ne "User" && "$name" ne "System" && "$name" ne "Elapsed") || ("$delta" <
0.05 * $mean) || ($count > 30)' --. Getstats is our generic results
processing engine; for a complete description See Getstats.
Getstats can run arbitrary predicates using various summary statistics
(e.g., the mean, median, or standard deviation). The predicate is
checked for each quantity that Auto-pilot measures. The first part of
the predicate, ("$name" ne "User" && "$name" ne "System" &&
"$name" ne "Elapsed"), skips all but User, System, and Elapsed time,
because these are the measured quantities we are generally interested
in. Wait time and CPU utilization are excluded because they are derived
from these quantities.
The next portion of the predicate, ("$delta" < 0.05 * $mean),
returns true if the half-width of a confidence interval (the confidence
level is 95% by default) is less than 5% of the mean.
The final portion, ($count > 30) prevents a poorly behaving test
from executing for more than 30 iterations.
The TERMINATE variable is rather long, and spans multiple lines using a backslash. To continue a line, the backslash must be the very last character before the newline (no spaces are allowed).
We then set another two variables NTHREADS (line 24), which is later used to determine the maximum number of threads, and TESTFS (line 27) which is used to determine the file systems to execute the benchmark on.
The next directive (on line 32), is INCLUDE
common.inc (this file is included with the Auto-pilot distribution). The
common.inc file performs
several tasks:
FASTFAIL directive is used so that benchmarks stop after one
fails.
To override any previous settings, and define new ones without editing the installed configuration files you should create a local.inc in the directory where you run the benchmarks. For example, if you wanted to use another predicate, then you would override TERMINATE here. You also need to set the TESTDEV, TESTROOT, RESULTS, LOGS, OKADDR, and FAILADDR.
An example local.inc could have the following:
     RESULTS=$HOME$/results/%BENCH%
     LOGS=$HOME$/logs/%BENCH%

     VAR TESTFS=ext2
     VAR NOSERVICES=1

     ENV FORMAT=1
     ENV TESTDEV=/dev/sda1
     ENV TESTROOT=/mnt/test

     ENV OKADDR=you@example.com
     ENV FAILADDR=you@example.com
In this example, the results files are stored under the current user's home directory in results/%BENCH%, where %BENCH% is the name of the benchmark as defined in the configuration file. The stdout/stderr logs are similarly stored in logs/%BENCH% under the current user's home directory.
The third directive, VAR TESTFS=ext2, overrides the default value
of TESTFS, so that only ext2 is tested. The fourth causes
common.inc to shutdown excess services.
The remaining lines set environment variables that are used by the default Auto-pilot shell scripts. Setting FORMAT to 1 causes the scripts to recreate the file system. TESTDEV determines what device should be used, and TESTROOT determines what directory is used.
The two remaining lines set addresses that should be used to send email. OKADDR, FAILADDR are the address that mail is sent to on successful completion and failure, respectively. I have found it useful to add .procmailrc recipes like the following to forward these messages to a mobile phone:
     # Send a copy of all messages with a subject starting with Benchmarks to
     # another email address for Auto-pilot paging.
     :0 c
     * ^Subject: Benchmarks
     ! yourphone@telco.com
The remaining configuration files are similar to postmark.ap, and using these as templates you should be able to create your own.
Auto-pilot processes and executes configuration files that describe a
series of benchmarks. Post processing tools such as Getstats and
Graphit are used to read the results that it produces. Auto-pilot has
a rather simple command line structure. The simplest usage is simply
auto-pilot config.ap, which reads config.ap and
executes it. config.ap can also be a saved Auto-pilot
checkpoint.
The following command line options are supported:
Auto-pilot includes benchmarking scripts to run Postmark and compile benchmarks on several file systems. We also include hooks that add functionality to the basic scripts, including measuring network utilization, I/O operations, benchmarking JFS and XFS, benchmarking stackable file systems and more. The scripts run as the same user as Auto-pilot, so many benchmarks can be executed without root privileges. However, our file system scripts often need to format, mount, and unmount partitions: which requires root access on most Unix systems.
All of the included scripts first require commonsettings, which is located in /usr/local/share/auto-pilot by default. commonsettings first verifies that various Auto-pilot variables are set. Auto-pilot automatically sets the following variables:
SETUP, EXEC, CLEANUP, PRESETUP, and
POSTCLEANUP.
You must set the following variable manually:
commonsettings automatically assigns sensible defaults to these variables:
aptime $APLOG.
commonsettings includes commonfunctions, which has various
shell functions. For extensibility, commonsettings searches each path
in the APLIB environment variable for a directory named
commonsettings.d, each file in that directory is sourced by the
shell. Additionally, commonsettings.`uname -n` is loaded.
uname -n expands to the machine's host name, so different machines
can have slightly different configurations, but share scripts.
The functions defined by commonfunctions are as follows:
ap_actionap_hookap_requirehookAP_TYPE_HOOK is executed. If no hook is defined, then
ap_hook returns success, but ap_requirehook returns failure.
ap_logap_logexecap_log uses echo to write its arguments to the file,
whereas ap_logexec executes a program and saves its stdout
stream to the log file.
ap_measure [measurement]
thread = 2
epoch = 2
command = postmark /tmp/postmark_config-9868
user = 0.200000
sys = 1.170000
elapsed = 5.470682
status = 0
The [measurement], thread, and epoch lines are produced by
ap_measure. Then a measurement hook is called. The first
argument to a measurement hook is either premeasure,
start, end, or final. The remaining arguments are
the program being executed.
The measure hook is called with premeasure first. A premeasure hook
can be used to execute relatively long running initial measurements that
should not be included by other hooks, or perform any other operation
that prepares for measurement.
Next, the measurement hook is called with start, which should save any
information that is needed for a measurement (e.g., the initial value of
a measured quantity).
At this point the actual benchmark is executed through $APTIMER.
By default, the aptime program is used. aptime
produces the command, user, sys, elapsed, and status portions of the
measurement block.
Finally, the measurement hook is called two more times. First, it is called
with an argument of "end". At this point measurements should complete, and
more quantities can be added to the measurement block. New blocks should not
be created yet, because other measurement hooks may want to add quantities to
the main measurement block. After all measurement hooks have been executed
with the "end" argument, they are called one last time with "final." At this
point new blocks can be created.
ap_snapap_snap adds several blocks to the file that describe the machine being
executed on. The first is a uname block that prints the vital
statistics from uname. A users block contains the output of
w. cpuinfo, meminfo, and mounts contain
the contents of their respective /proc files. df contains
the output of df -k, and if TESTDEV is set to an Ext2 file
system, dumpe2fs contains the output of dumpe2fs -h.
This snapshot of the machine state can be used to reproduce results more
accurately, or help explain why results are different.
ap_unmountap_unmount attempts to unmount the file system mounted on a
directory or device. If the file system is not mounted, then it returns
success. If the umount command fails, or file system is not
unmounted after an unmount is attempted, then it returns failure.
Before executing the umount command, an unmount hook is called
with an argument of the file system to be unmounted.
ap_snap on the setup phase of the first epoch.
See File System Scripts, for information on how Auto-pilot formats, mounts, and unmounts file systems. See Postmark, for information about how Auto-pilot runs the Postmark benchmark. See Compile Benchmarks, for information on executing compile benchmarks. See Included Script Plugins, for information about the various plugins that are included with Auto-pilot's benchmarking scripts.
Auto-pilot includes a file system setup script, fs-setup.sh, that formats and mounts a file system, and a corresponding script fs-cleanup.sh that later unmounts it. By default, Ext2, Ext3, and Reiserfs are supported, but the scripts are sufficiently extensible to allow other types of file systems to be mounted. The special file system type none bypasses file system setup and cleanup (this can be used if you mount your file system outside of Auto-pilot, but do not want to modify the default scripts).
The file system setup script takes a single argument on the command line, which is the file system type to mount (e.g., ext2 or reiserfs).
Aside from the command line argument, the file system setup script is controlled by several environment variables:
First, TESTROOT and TESTDEV are unmounted using the
ap_unmount function. This is designed to prevent previous failed
iterations of a test from impacting this iteration.
Next, if FORMAT is 1, ap_initfs is called to format the
file system.
The ap_initfs function takes the file system type as its only
argument. It formats TESTDEV with the specified file system time,
and uses FSSIZE to determine how many megabytes the file system
is.
Before executing mkfs, it calls the "mkfsopts" hook. This
hook takes four arguments, the file system time, the device, the block
size, and the file system size. It prints any additional options to
pass to mkfs on stdout. Next, for ext2, ext3, and
reiserfs the file system is formatted using mkfs.
For other file system types, a mkfs hook is called. The
mkfs hook takes the same arguments as mkfsopts, and
formats the file system according to the arguments and environment
variables. If a mkfs hook is not defined, then
ap_initfs fails.
After the file system is formatted, a tunefs hook is called
with two arguments: the file system type and the device. The tunefs
hook can modify file system properties. For example, a tunefs hook can
toggle directory indexing on an Ext2 or Ext3 partition.
After the file system is formatted, it is mounted. First, a mount hook
is called with arguments of $FSTYPE $TESTDEV $TESTROOT. This
hook can perform pre-mount operations, or mount the file system itself.
To suppress fs-setup.sh from mounting the file system, the hook
can set DOMOUNT to zero.
After the mount is completed, a postmount hook is called with the same
arguments as the mount hook.
Finally, TESTDIR is created if it does not already exist.
The file system cleanup script, fs-cleanup.sh, is simpler than
the setup script. After loading commonsettings, the
unmount hook is called with arguments of $TESTDEV
$TESTROOT, and then ap_unmount is called with an argument of
TESTROOT.
Postmark is a benchmark designed to simulate the behavior of mail servers. Postmark consists of three phases. In the first phase a pool of files are created. In the next phase four types of transactions are executed: files are created, deleted, read, and appended to. In the last phase, all files in the pool are deleted. See http://www.netapp.com/tech_library/3022.html for more information on Postmark.
Postmark is a single threaded benchmark, but Auto-pilot can automatically run several concurrent processes and analyze the results. Postmark generates a small workload by default: only 500 files are created and 500 transactions performed. Auto-pilot increases the workload to a pool of 20,000 files, and performs 200,000 transactions by default.
Several environment variables control how Postmark behaves when running under Auto-pilot that you can set in local.inc:
| Variable | Default | Description |
|---|---|---|
| BUFFERING | false | Use C library functions like
fopen instead of system calls like open.
|
| CREATEBIAS | 5 | What fraction (out of 1) of create/delete operations are create. -1 turns off creation and deletion. |
| INITFILES | 20000 | How many files are in the initial pool. |
| MINSIZE | 512 | The minimum file size. |
| MAXSIZE | 10240 | The maximum file size. |
| MYINITFILES | $INITFILES/$THREADS | Number of initial files in this process's pool. |
| MYSUBDIRS | $SUBDIRS/$THREADS | Number of subdirectories for this process. |
| MYTRANSACTIONS | $TRANSACTIONS/$THREADS | Number of transactions this process executes. |
| POSTMARKDIR | $TESTDIR/postmark/$APTHREAD | What directory to run in. |
| READBIAS | 5 | What fraction (out of 10) of read/append operations are read. -1 turns off read and append. |
| READSIZE | 4096 | The unit (in bytes) that read operations are executed in. |
| SEED | 42 | The seed for random number generation. |
| THREADS | 1 | How many concurrent processes to run (this variable is automatically set by the Auto-pilot THREADS directive).
|
| TRANSACTIONS | 200000 | How many total transactions to execute. |
| WRITESIZE | 4096 | The unit (in bytes) that write operations are executed in.
|
The Postmark script generates a configuration based on these variables,
and then decrements the semaphore specified by APIPCKEY.
Decrementing this semaphore using semdec ensures that all threats
begin processing and measuring at approximately the same time. After
semdec returns, postmark is run via ap_measure.
Finally, the configuration and any left over files are removed.
Auto-pilot includes compile.sh, which can be used to benchmark
the unpacking, compilation, and removal of several packages. We have
tested it with GCC, OpenSSL, and Am-Utils. No command line arguments
are passed to compile.sh. It is controlled entirely with
environment variables.
The two most important variables to set are DATADIR and
BENCH. DATADIR is the directory where you have stored the
package to compile, and BENCH is which program to compile. If
BENCH is gcc, openssl, or amutils, then the
PACKAGE variable is automatically set, otherwise PACKAGE
must be defined. PACKAGE is the prefix of the source package
(e.g., gcc). Using these two variables, compile.sh
searches for all files that match $DATADIR/$PACKAGE*.
If only one file matches, then it is automatically selected as the
package file and stored in the environment variable PKGFILE. If
no file is found or multiple files are found, then compile.sh
fails, and you should correct the problem. If you set PKGFILE
before compile.sh begins, then no automatic search is performed.
After determining PKGFILE, compile.sh unpacks it using tar and changes the present working directory to the one extracted by tar. This assumes that the package is well behaved, and creates only one top-level directory. If this assumption is violated, an error message is printed.
If you set BENCH to one of the predefined benchmarks, then
compile.sh already contains the commands to compile the
script. If you are compiling your own package, then you should either
create a compilecommand hook or set the COMPILECMD variable
to the command you want executed.
If you need to perform multiple commands, and want them timed separately,
then you need to use a compilecommand hook. The hook takes two
arguments. The first is PACKAGE and the second is PKGFILE.
If the hook returns success, then it must set the environment variable
CMDLIST to an array containing each command to execute. For
example, to compile GCC the following statements are used:
I=0
CMDLIST[$((I++))]=./configure
CMDLIST[$((I++))]=make
If neither the COMPILECMD variable or the compilecommand
hook are defined, the compilation fails.
After compilation, the package is removed.
By default, all three phases are executed (unpacking, compilation, and deletion). To disable a phase set UNPACK, COMPILE, or DELETE to "0".
This section describes the script hooks that are included with the Auto-pilot distribution.
This hook enables or disables hash trees on Ext2 and Ext3 using the tunefs hook. To enable, set the HTREE environment variable to yes or no, which enables or disables directory indexing, respectively. If HTREE is not set, then hash trees are not changed.
This mkfs hook adds support for creating JFS file systems. The BLOCKSIZE and FSSIZE parameters are ignored. JFS does not need a mount or unmount hook, as fs-setup.sh already handles it.
This hook adds extra fields to each measurement block describing the amount of used and free memory as reported by /proc/meminfo. The new fields are: MemTotal, MemFree, MemShared, Buffers, SwapTotal, and SwapFree. You can use this hook to see if the program is leaking memory or just to measure the memory usage of various workloads. To enable, set the environment variable MEASURE_MEMINFO.
This measures how many bytes are sent and received over a network interface. To enable set NETUTILIF to the interface to be measured (e.g., eth0).
This hook measures the number of I/O operations that took place during a benchmark based on /proc/partitions statistics. To use this hook you must have set CONFIG_BLK_STATS when you compiled your kernel. If you are unsure, cat /proc/partitions. If you have rio and wio columns, then you can use this hook, otherwise you need to recompile the kernel.
This hook has two functions. First it can add a new column to Getstats for a specific partition (e.g., "hda2"), you can enable this functionality by setting the environment variable PARTDIFF_LIST to a space separated list of partitions to measure. Second, a list of partitions and the differences of interesting values (those that are non-zero) are printed in a new block named partdiff. This can be useful for analyzing odd results. If you just want this block to be produced set the MEASURE_PARTDIFF environment variable to a non-zero value.
This hook measures the amount of CPU time used by background processes. This hook has three distinct functionalities:
PROCDIFF_PROCS="nfsd" should match nfsd processes. The regular
expression can be useful when your processes have numbers or other minor
variations. The regular expression is a POSIX Extended Regular Expression
(specifically the C library's regcomp function with the
REG_EXTENDED|REG_NOSUB arguments is used).
Set PROCDIFF_THRESHOLD to change the amount of CPU time (in milliseconds) that is ignored. By default 10ms (1 quantum on various Linux kernels) is ignored.
This hook functions the same as procdiff, except it is designed for execution on a remote system. To reduce execution time and connections to the server, only specified processes are measured.
To use this hook you must set the following variables:
The following variables are set automatically, but you may need to override them :
| Variable | Default | Description
|
|---|---|---|
| AP_SSH | ssh -n | What SSH command to use for remote execution. You need to change this if you want to use RSA identity files or other similar mechanisms. You can also use RSH instead of SSH. |
| RPDIFFSCRIPT | apremote.sh procdiff |
What is the name of the remote script to execute? apremote.sh
is a shell script included in the distribution that executes procdiff or
other commands defined using an apremote hook.
|
This hook adds a measurement column for Getstats that measures the number of SCSI commands queued on Adaptec SCSI adapters. Set the environment variable MEASURE_SCSISTAT to enable this hook.
This hook is used to mount and unmount FiST generated stackable file systems (http://www.filesystems.org). This hook includes the list sample file systems included with the FiST. To add your own stackable file system to the list of file systems handled by this hook, set the STACKFS environment variable to a space separated list of file system names. If you need extra mount options, set the environment variable STACKOPTS.
You must set LOWERFS to the type of file system you want to mount. If modprobe can not find your stackable module, then you need to set MODDIR to the location of your modules.
The lower level file system is mounted on /n/lower by default. The LOWERROOT environment variable overrides this value.
The strace measurement hook creates a new block with system call counts for each measured process. To enable this hook set the environment variable MEASURE_STRACE.
This mkfs hook adds support for creating XFS file systems. XFS does not need a mount or unmount hook, as fs-setup.sh already handles it.
There are essentially four ways to customize your benchmark scripts. First, you can simply run programs that don't have complex setup or cleanup directly. A small shell script aptime.sh is included in the distribution that executes and and measures a single command. The configuration cksum.ap uses aptime.sh to run various checksumming programs.
Section Hooks describes how to benchmark new file systems or add functionality to the existing benchmarking scripts. To replace the existing benchmarking scripts (e.g., postmark.sh and compile.sh with your own benchmarks, See New Workloads. To replace the file-system setup scripts with scripts from your own domain, See New Benchmark Domains.
Auto-pilot's benchmarking scripts include nine points in which you can insert your own code without modifying the original scripts. These hooks allow you to benchmark new file systems, compile new programs, and measure new quantities. The first three hooks are generic, and not related to file systems:
measure (premeasure|start|end|final)The remaining arguments are the command that is being measured.
compilecommand PACKAGE PKGFILE I=0
CMDLIST[$((I++))]=./configure
CMDLIST[$((I++))]=make
apremoteapremote hook. The first argument is the
command passed to apremote.sh, and the remaining arguments are
the arguments for that command.
The remaining hooks are used by the file system setup scripts.
mkfsopts FS TESTDEV BLOCKSIZE FSSIZEmkfsopts hook is called before mkfs. This hook
takes four arguments, the file system time, the device, the block size,
and the file system size. It should print any additional options to pass to
mkfs on stdout.
mkfs FS TESTDEV BLOCKSIZE FSSIZEmkfs hook to properly format the file system.
The mkfs hook takes the same arguments as mkfsopts,
and formats the file system according to the arguments and environment
variables.
tunefs FS TESTDEVmount FSTYPE TESTDEV TESTROOT$FSTYPE $TESTDEV $TESTROOT. This hook can perform pre-mount
operations, or mount the file system itself. To suppress
fs-setup.sh from mounting the file system, the hook can set
DOMOUNT to zero.
postmount FSTYPE TESTDEV TESTROOTunmount TESTDEV TESTROOTDefining new workloads is relatively simple—all that is strictly required is that you have a program that executes the workload and measures it somehow. However, to fit into the Auto-pilot analysis infrastructure you should keep in mind the following points:
You should include commonsettings so that you can use
ap_measure.You should use ap_measure so that you can
process the results easily with Getstats. You should measure each
component of your benchmark separately (e.g., a compilation should
separately measure ./configure and make).
We have found that reusing benchmark scripts is very useful, but each project often needs small changes. Originally, these changes resulted in several incarnations of each script (one for each project); and maintenance became very difficult. Therefore, we suggest that you design your scripts in such a way that they can be extended for specific projects without forks.
Make as much of your benchmark configurable with environment variables as possible. Use a function like set_default so that you do not need to define every configuration option in your Auto-pilot configuration. This achieves a reasonable balance between avoiding modifications to the benchmark script, and making it easy to use.
Insert hooks liberally into your script when environment variables are not sufficient to allow extensibility. This again helps to avoid modifications to your script.
Writing benchmark scripts for new domains requires forethought, and the same principles that apply to writing scripts for new workloads applies to writing scripts for new benchmark domains, See New Workloads. There are not necessarily any hard and fast rules, since everyone's benchmarks are different, but we have found that it helps to keep the following things in mind when developing file-system benchmarks.
The setup, benchmark, and cleanup should be clearly separated. If you
are benchmarking multiple systems of the same type, then you should have
common setup and cleanup scripts, with small blocks of if statements
that change the behavior for the different systems (e.g., we have one
fs-setup.sh script that handles all file systems). Instead of
simply failing if your script does not recognize the system you are
benchmarking, use ap_requirehook to search for a plugin.
Use variables for all of your options, and make sure you support host-specific options. If you include commonsettings, the host-specific options are already taken care of.
Finally, your setup script should actually perform a bit of cleanup as well. For example, our fs-setup.sh script unmounts any file system that is already mounted. This is important, because you don't want a previous bad run of your benchmarks to cause the next iteration to fail.
The basic Auto-Pilot work flow is essentially that Auto-pilot produces
two files for each experiment (as defined by a TEST directive in
your .ap file). The first file is a log of stdout and stderr,
with the suffix .log. No processing is done on this file—it is just
there so you can take a look at what happened (for example, if something broke
or you can't explain your results). The second file is more interesting—it is
the results file which has the suffix .res. The results file contains
information that the benchmarker deems worthy of automatic extraction (the
default Auto-pilot scripts record time and optionally several other
quantities, see Included Script Plugins).
The results files are made up of blocks, which start with
[blockname], and then contain simple text (for example, the
system snapshot contains the output of various commands, without any
special formatting). Each command that is measured with the
ap_measure function creates a measurement block, which looks like
the following:
          [measurement]
          thread = 2
          epoch = 2
          command = postmark /tmp/postmark_config-9868
          user = 0.200000
          sys = 1.170000
          elapsed = 5.470682
          status = 0
Using a measure hook, arbitrary fields can be added to this measurement. The Auto-Pilot distribution has two measure hooks distributed by default. The first keeps track of the number of SCSI commands queued on Adaptec SCSI cards. The second determines the amount of CPU time used by all processes in the system, which can be compared with the amount of CPU time your benchmark used. These two hooks have proven useful to investigate possible anomalies. These hooks in @pkgdatadir@/commonsettings.d can be used as samples for creating your own measurement hooks. By default @pkgdatadir@ is /usr/local/share/auto-pilot.
After you have these results files, you can pass them through the Getstats program. Getstats is an automated and powerful way to transform the results files into nicely formatted tables, and to compare two different results files.
If you just want to know how to use Getstats and not how it works then read only this Chapter. If you want to understand the internals, and perform more complex transformations, then you should read Getstats Internals.
Getstats starts off by processing its command line. The command line consists of options and transformations, followed by a list of files to read.
Getstats takes each transformation that is specified on the command line and
pushes it onto a stack (@TRANSFORMS) for later use.
Each file that is specified on the command line is parsed into a two dimensional array. You can specify either a CSV file, an Auto-pilot results file, or a sequence of GNU time output. Getstats automatically determines the right file type and parse the file. Getstats Parsers describes how to add your own parser. The two dimensional array is a relation that Getstats then manipulates. The relation consists of labels (or names) for each field, and then rows (or tuples) with a value for each field.
Each individual transformation on the @TRANSFORMS stack is done to each
of the relations, in turn. If two transformations are specified A and B; and
there are two files R and S, then A is applied to R, A is applied to S, B is
applied to R, and finally B is applied to S.
This section describes how to produce tabular reports, how to convert a results file into a CSV file, and how to do simple hypothesis testing with Getstats.
The simplest form of invocation is just: getstats file, where
file is a results, CSV, or GNU time file. For example, the
command getstats ext2:1.res produces the following tabular
report:
     ext2:1.res: High z-score of 2.21853230276562 for elapsed in epoch 3.
     ext2:1.res: High z-score of 2.03783855068 for io in epoch 3.
     ext2:1.res
     NAME    COUNT MEAN   MEDIAN LOW    HIGH   MIN    MAX    SDEV% HW%
     Elapsed 10    6.055  6.063  5.991  6.120  5.855  6.180  1.491 1.067
     System  10    2.758  2.760  2.709  2.807  2.640  2.880  2.499 1.788
     User    10    1.675  1.680  1.615  1.735  1.510  1.820  5.044 3.609
     Wait    10    1.622  1.636  1.567  1.677  1.465  1.718  4.759 3.404
     CPU%    10    73.221 73.079 72.572 73.871 72.007 74.981 1.240 0.887
In this report, we see that elapsed time had a z-score of 2.2 in the third
iteration (i.e., the value was 2.2 standard deviations away from the mean). We
also see that I/O time was 2.0 standard deviations away from the mean. Because
this is only a single test, and is not that far away, we can still analyze the
results without much concern.
We then see that there were ten values for Elapsed, System, and User time. Two
additional quantities are reported: Wait, which is the Elapsed time less CPU
time used (i.e. Wait = Elapsed - (System + User)); and CPU utilization.
We also see the mean and median values. The LOW and HIGH columns
are used to create error bars with Graphit (See Graphit). The MIN
and MAX columns are the minimum and maximum values.
The last two columns are the standard deviation and the half-width of a 95%
confidence interval, presented as a percentage of the mean.
The second most common usage of Getstats is probably to compare two
results files and print out the percentage overhead for each measured
quantity. Simply add more files on the command line, and each
subsequent one is compared with the first file. For example,
getstats ext2:1.res ext2:2.res ext2:4.res produces similar
warnings, and three tables, the second two of which have an overhead
column.
     ext2:1.res: High z-score of 2.21853230276562 for elapsed in epoch 3.
     ext2:1.res: High z-score of 2.03783855068 for io in epoch 3.
     ext2:2.res: High z-score of 2.02151683729612 for io in epoch 9.
     ext2:2.res: High z-score of 2.04675213832333 for cpu in epoch 9.
     ext2:4.res: High z-score of 2.67440053238888 for elapsed in epoch 17.
     ext2:4.res: High z-score of 3.49505543943413 for elapsed in epoch 18.
     ext2:4.res: High z-score of 2.08010266128444 for user in epoch 24.
     ext2:4.res: High z-score of 2.07085419644225 for sys in epoch 7.
     ext2:4.res: High z-score of 2.7647669231535 for io in epoch 17.
     ext2:4.res: High z-score of 3.4658463687201 for io in epoch 18.
     ext2:4.res: High z-score of 2.78135167661708 for cpu in epoch 17.
     ext2:4.res: High z-score of 3.57552849516685 for cpu in epoch 18.
     ext2:1.res
     NAME    COUNT MEAN   MEDIAN LOW    HIGH   MIN    MAX    SDEV%  HW%
     Elapsed 10    6.055  6.063  5.991  6.120  5.855  6.180  1.491  1.067
     System  10    2.758  2.760  2.709  2.807  2.640  2.880  2.499  1.788
     User    10    1.675  1.680  1.615  1.735  1.510  1.820  5.044  3.609
     Wait    10    1.622  1.636  1.567  1.677  1.465  1.718  4.759  3.404
     CPU%    10    73.221 73.079 72.572 73.871 72.007 74.981 1.240  0.887

     ext2:2.res
     NAME    COUNT MEAN   MEDIAN LOW    HIGH   MIN    MAX    SDEV%  HW%   O/H
     Elapsed 11    4.904  4.966  4.793  5.015  4.579  5.042  3.377  2.269 -19.012
     System  11    2.524  2.520  2.478  2.569  2.410  2.630  2.695  1.810 -8.498
     User    11    0.811  0.810  0.774  0.848  0.740  0.910  6.720  4.514 -51.588
     Wait    11    1.569  1.616  1.453  1.686  1.219  1.748  11.057 7.428 -3.253
     CPU%    11    68.075 67.141 66.332 69.818 65.164 73.385 3.811  2.560 -7.029

     ext2:4.res
     NAME    COUNT MEAN   MEDIAN LOW    HIGH   MIN    MAX    SDEV%  HW%   O/H
     Elapsed 31    4.300  4.318  4.230  4.369  3.636  4.513  4.413  1.619 -28.993
     System  31    2.360  2.350  2.333  2.387  2.220  2.510  3.069  1.126 -14.431
     User    31    0.502  0.470  0.476  0.528  0.410  0.650  14.141 5.187 -70.014
     Wait    31    1.437  1.472  1.366  1.508  0.766  1.667  13.467 4.940 -11.396
     CPU%    31    66.708 65.822 65.455 67.961 62.851 78.923 5.121  1.879 -8.895
When running Getstats, you may want to skip the leading warnings,
because you are impatient and don't want to wait for them to complete
(e.g., if you've already looked at them), or you simply don't want the
output (e.g., if you are using the output in an automated Graphit
script). To disable warnings, simply add --set warn=0 to the
command line. The command getstats --set warn=0
samples/ext2:1.res produces the tabular report alone, as follows:
     ext2:1.res
     NAME    COUNT MEAN   MEDIAN LOW    HIGH   MIN    MAX    SDEV% HW%
     Elapsed 10    6.055  6.063  5.991  6.120  5.855  6.180  1.491 1.067
     System  10    2.758  2.760  2.709  2.807  2.640  2.880  2.499 1.788
     User    10    1.675  1.680  1.615  1.735  1.510  1.820  5.044 3.609
     Wait    10    1.622  1.636  1.567  1.677  1.465  1.718  4.759 3.404
     CPU%    10    73.221 73.079 72.572 73.871 72.007 74.981 1.240 0.887
The --set option, is actually rather generic. It can be used
to set any Getstats internal variable. You can also turn off the
overhead column, with --set overhead=0. For example,
getstats --set overhead=0 --set warn=0 ext2:1.res ext2:2.res
produces the following:
     ext2:1.res
     NAME    COUNT MEAN   MEDIAN LOW    HIGH   MIN    MAX    SDEV%  HW%
     Elapsed 10    6.055  6.063  5.991  6.120  5.855  6.180  1.491  1.067
     System  10    2.758  2.760  2.709  2.807  2.640  2.880  2.499  1.788
     User    10    1.675  1.680  1.615  1.735  1.510  1.820  5.044  3.609
     Wait    10    1.622  1.636  1.567  1.677  1.465  1.718  4.759  3.404
     CPU%    10    73.221 73.079 72.572 73.871 72.007 74.981 1.240  0.887

     ext2:2.res
     NAME    COUNT MEAN   MEDIAN LOW    HIGH   MIN    MAX    SDEV%  HW%
     Elapsed 11    4.904  4.966  4.793  5.015  4.579  5.042  3.377  2.269
     System  11    2.524  2.520  2.478  2.569  2.410  2.630  2.695  1.810
     User    11    0.811  0.810  0.774  0.848  0.740  0.910  6.720  4.514
     Wait    11    1.569  1.616  1.453  1.686  1.219  1.748  11.057 7.428
     CPU%    11    68.075 67.141 66.332 69.818 65.164 73.385 3.811  2.560
If you want to adjust the confidence interval, you also use --set. If you wanted tighter confidence intervals, you could use getstats --set confidencelevel=99 ext2:1.res, and the output would change as follows:
     ext2:1.res: High z-score of 2.21853230276562 for elapsed in epoch 3.
     ext2:1.res: High z-score of 2.03783855068 for io in epoch 3.
     ext2:1.res
     NAME    COUNT MEAN   MEDIAN LOW    HIGH   MIN    MAX    SDEV% HW%
     Elapsed 10    6.055  6.063  5.962  6.148  5.855  6.180  1.491 1.532
     System  10    2.758  2.760  2.687  2.829  2.640  2.880  2.499 2.568
     User    10    1.675  1.680  1.588  1.762  1.510  1.820  5.044 5.184
     Wait    10    1.622  1.636  1.543  1.701  1.465  1.718  4.759 4.891
     CPU%    10    73.221 73.079 72.289 74.154 72.007 74.981 1.240 1.274
There are several other variables, which are described within the transform that they control.
After parsing the results file, Getstats runs several default
transformations as described in Default Function Library. These
transformations essentially combine the results from several tests, and produce
the derived quantities (e.g., Wait time). If we want to see these raw values
we can use the --dump transform. The following output is produced by
getstats --dump ext2:1.res:
     epoch elapsed user  sys   io    cpu
     1     6.138   1.700 2.720 1.718 72.007
     2     6.026   1.820 2.640 1.566 74.015
     3     5.855   1.590 2.800 1.465 74.981
     4     5.983   1.680 2.750 1.553 74.045
     5     6.063   1.730 2.700 1.633 73.071
     6     6.180   1.680 2.790 1.710 72.331
     7     6.043   1.510 2.880 1.653 72.645
     8     6.089   1.680 2.770 1.639 73.086
     9     6.063   1.630 2.820 1.613 73.396
     10    6.113   1.730 2.710 1.673 72.637
     ext2:1.res: High z-score of 2.21853230276562 for elapsed in epoch 3.
     ext2:1.res: High z-score of 2.03783855068 for io in epoch 3.
     ext2:1.res
     NAME    COUNT MEAN   MEDIAN LOW    HIGH   MIN    MAX    SDEV% HW%
     Elapsed 10    6.055  6.063  5.991  6.120  5.855  6.180  1.491 1.067
     System  10    2.758  2.760  2.709  2.807  2.640  2.880  2.499 1.788
     User    10    1.675  1.680  1.615  1.735  1.510  1.820  5.044 3.609
     Wait    10    1.622  1.636  1.567  1.677  1.465  1.718  4.759 3.404
     CPU%    10    73.221 73.079 72.572 73.871 72.007 74.981 1.240 0.887
As we can see the tabular report is still printed. This is because the
standard transforms are being executed before and after the
--dump transformation. To solve this problem, we can simply
exit after the dump by adding --eval "exit(0);". The complete
command getstats --dump --eval "exit(0);" ext2:1.res produces:
     epoch elapsed user  sys   io    cpu
     1     6.138   1.700 2.720 1.718 72.007
     2     6.026   1.820 2.640 1.566 74.015
     3     5.855   1.590 2.800 1.465 74.981
     4     5.983   1.680 2.750 1.553 74.045
     5     6.063   1.730 2.700 1.633 73.071
     6     6.180   1.680 2.790 1.710 72.331
     7     6.043   1.510 2.880 1.653 72.645
     8     6.089   1.680 2.770 1.639 73.086
     9     6.063   1.630 2.820 1.613 73.396
     10    6.113   1.730 2.710 1.673 72.637
This output, however, is post processed. To produce raw output, we need
to disable the standard transforms by passing
--nostdtransforms. The command getstats
--nostdtransforms --dump ext2:1.res produces the following table (note
that we do not need to suppress the default tabular report, as
--nostdtransforms already suppresses it):
     thread epoch command                             status elapsed user  sys
     1      1     postmark /tmp/postmark_config-30126 0      6.138   1.700 2.720
     1      2     postmark /tmp/postmark_config-30312 0      6.026   1.820 2.640
     1      3     postmark /tmp/postmark_config-30498 0      5.855   1.590 2.800
     1      4     postmark /tmp/postmark_config-30684 0      5.983   1.680 2.750
     1      5     postmark /tmp/postmark_config-30870 0      6.063   1.730 2.700
     1      6     postmark /tmp/postmark_config-31056 0      6.180   1.680 2.790
     1      7     postmark /tmp/postmark_config-31242 0      6.043   1.510 2.880
     1      8     postmark /tmp/postmark_config-31428 0      6.089   1.680 2.770
     1      9     postmark /tmp/postmark_config-31614 0      6.063   1.630 2.820
     1      10    postmark /tmp/postmark_config-31800 0      6.113   1.730 2.710
To produce CSV files, which are suitable for use with other programs,
you can replace --dump with --csv. For example, getstats
--nostdtransforms --csv ext2:1.res produces
     "thread","epoch","command","status","elapsed","user","sys"
     "1","1","postmark /tmp/postmark_config-30126","0","6.138273","1.700000","2.720000"
     "1","2","postmark /tmp/postmark_config-30312","0","6.025781","1.820000","2.640000"
     "1","3","postmark /tmp/postmark_config-30498","0","5.854844","1.590000","2.800000"
     "1","4","postmark /tmp/postmark_config-30684","0","5.982848","1.680000","2.750000"
     "1","5","postmark /tmp/postmark_config-30870","0","6.062588","1.730000","2.700000"
     "1","6","postmark /tmp/postmark_config-31056","0","6.179898","1.680000","2.790000"
     "1","7","postmark /tmp/postmark_config-31242","0","6.043082","1.510000","2.880000"
     "1","8","postmark /tmp/postmark_config-31428","0","6.088717","1.680000","2.770000"
     "1","9","postmark /tmp/postmark_config-31614","0","6.062965","1.630000","2.820000"
     "1","10","postmark /tmp/postmark_config-31800","0","6.112608","1.730000","2.710000"
Getstats supports simple hypothesis testing using a two sample t-test. If you have two samples (i.e., configurations), and you want to determine whether one configuration's results is larger than, smaller than, or equal to the other configuration's results you can use the --twosamplet transform. The --twosamplet operates like the overhead transform in that the first file on the command line is compared to each subsequent file on the command line. Before executing the command you should pick your null hypothesis, which is what you assume to be true (and would like to disprove). For example, if you just spent time optimizing a function, then you should assume your new software is slower than the existing software, and seek to prove otherwise. You can also assume that two samples are equal, and then seek to differentiate them (if you fail, then the results are statistically indistinguishable).
For a primer on hypothesis testing, I suggest reading any statistics book such as Ott and Longnecker's "An Introduction to Statistical Methods and Data Analysis", MathWorld at http://mathworld.wolfram.com/HypothesisTesting.html or WikiPedia at http://en.wikipedia.org/wiki/Hypothesis_testing.
For example, to compare grep:reboot.res with
grep:noreboot.res, you should run getstats
--twosamplet grep:noreboot.res
grep:reboot.res. This command produces the basic tabular
report, and afterwards each quantity is compared as follows:
     grep:noreboot.res: High z-score of 2.33972893857958 for elapsed in epoch 7.
     grep:noreboot.res: Linear regression slope for sys is: 1.856%.
     grep:reboot.res: High z-score of 2.82303417219122 for elapsed in epoch 1.
     grep:reboot.res: High z-score of 2.33133550896239 for sys in epoch 3.
     grep:reboot.res: High z-score of 2.47125762323635 for io in epoch 1.
     grep:noreboot.res
     NAME    COUNT MEAN   MEDIAN LOW    HIGH   MIN    MAX    SDEV% HW%
     Elapsed 10    38.751 38.699 38.580 38.921 38.465 39.307 0.614 0.439
     System  10    1.796  1.790  1.677  1.915  1.580  2.080  9.255 6.620
     User    10    23.806 23.730 23.614 23.998 23.430 24.330 1.130 0.808
     Wait    10    13.149 13.158 12.912 13.386 12.725 13.797 2.519 1.802
     CPU%    10    66.071 66.019 65.556 66.586 64.899 67.075 1.090 0.779

     grep:reboot.res
     NAME    COUNT MEAN   MEDIAN LOW    HIGH   MIN    MAX    SDEV% HW%   O/H
     Elapsed 10    40.422 40.661 39.885 40.960 38.301 40.788 1.859 1.330 4.314
     System  10    1.693  1.700  1.620  1.766  1.560  1.930  6.005 4.296 -5.735
     User    10    23.718 23.745 23.451 23.985 23.180 24.220 1.572 1.124 -0.370
     Wait    10    15.011 15.102 14.569 15.454 13.481 15.632 4.124 2.950 14.168
     CPU%    10    62.875 62.764 62.166 63.584 61.561 64.802 1.576 1.127 -4.837

     Comparing grep:reboot.res (Sample 1) to grep:noreboot.res (Sample 2).
     Elapsed: 95%CI for grep:reboot.res - grep:noreboot.res = (1.148, 2.195)
     Null Hyp. Alt. Hyp. P-value Result
     u1 <= u2  u1 >  u2  0.000   REJECT H_0
     u1 >= u2  u1 <  u2  1.000   ACCEPT H_0
     u1 == u2  u1 != u2  0.000   REJECT H_0

     System: 95%CI for grep:reboot.res - grep:noreboot.res = (-0.232, 0.026)
     Null Hyp. Alt. Hyp. P-value Result
     u1 <= u2  u1 >  u2  0.944   ACCEPT H_0
     u1 >= u2  u1 <  u2  0.056   ACCEPT H_0
     u1 == u2  u1 != u2  0.112   ACCEPT H_0

     User: 95%CI for grep:reboot.res - grep:noreboot.res = (-0.393, 0.217)
     Null Hyp. Alt. Hyp. P-value Result
     u1 <= u2  u1 >  u2  0.724   ACCEPT H_0
     u1 >= u2  u1 <  u2  0.276   ACCEPT H_0
     u1 == u2  u1 != u2  0.552   ACCEPT H_0

     Wait: 95%CI for grep:reboot.res - grep:noreboot.res = (1.396, 2.329)
     Null Hyp. Alt. Hyp. P-value Result
     u1 <= u2  u1 >  u2  0.000   REJECT H_0
     u1 >= u2  u1 <  u2  1.000   ACCEPT H_0
     u1 == u2  u1 != u2  0.000   REJECT H_0

     CPU%: 95%CI for grep:reboot.res - grep:noreboot.res = (-4.009, -2.382)
     Null Hyp. Alt. Hyp. P-value Result
     u1 <= u2  u1 >  u2  1.000   ACCEPT H_0
     u1 >= u2  u1 <  u2  0       REJECT H_0
     u1 == u2  u1 != u2  0.000   REJECT H_0
From this report, we we can see that grep with an intervening reboot runs for a longer period of time than without the intervening reboot (because we reject the null hypothesis of u1 <= u2 for Elapsed time). We also see that System and User times are indistinguishable for the two tests. Wait and CPU time are however distinguishable (reboot has higher Wait, and lower CPU utilization).
If you want to have a quieter version of the t-test, pass --set
rejectonly=1 so that only rejected hypothesis are displayed. For
example, getstats --set warn=0 --set rejectonly=1 --twosamplet
produces the following:
     grep:noreboot.res
     NAME    COUNT MEAN   MEDIAN LOW    HIGH   MIN    MAX    SDEV% HW%
     Elapsed 10    38.751 38.699 38.580 38.921 38.465 39.307 0.614 0.439
     System  10    1.796  1.790  1.677  1.915  1.580  2.080  9.255 6.620
     User    10    23.806 23.730 23.614 23.998 23.430 24.330 1.130 0.808
     Wait    10    13.149 13.158 12.912 13.386 12.725 13.797 2.519 1.802
     CPU%    10    66.071 66.019 65.556 66.586 64.899 67.075 1.090 0.779

     grep:reboot.res
     NAME    COUNT MEAN   MEDIAN LOW    HIGH   MIN    MAX    SDEV% HW%   O/H
     Elapsed 10    40.422 40.661 39.885 40.960 38.301 40.788 1.859 1.330 4.314
     System  10    1.693  1.700  1.620  1.766  1.560  1.930  6.005 4.296 -5.735
     User    10    23.718 23.745 23.451 23.985 23.180 24.220 1.572 1.124 -0.370
     Wait    10    15.011 15.102 14.569 15.454 13.481 15.632 4.124 2.950 14.168
     CPU%    10    62.875 62.764 62.166 63.584 61.561 64.802 1.576 1.127 -4.837

     Comparing grep:reboot.res (Sample 1) to grep:noreboot.res (Sample 2).
     Elapsed: 95%CI for grep:reboot.res - grep:noreboot.res = (1.148, 2.195)
     Null Hyp. Alt. Hyp. P-value Result
     u1 <= u2  u1 >  u2  0.000   REJECT H_0
     u1 == u2  u1 != u2  0.000   REJECT H_0

     Wait: 95%CI for grep:reboot.res - grep:noreboot.res = (1.396, 2.329)
     Null Hyp. Alt. Hyp. P-value Result
     u1 <= u2  u1 >  u2  0.000   REJECT H_0
     u1 == u2  u1 != u2  0.000   REJECT H_0

     CPU%: 95%CI for grep:reboot.res - grep:noreboot.res = (-4.009, -2.382)
     Null Hyp. Alt. Hyp. P-value Result
     u1 >= u2  u1 <  u2  0       REJECT H_0
     u1 == u2  u1 != u2  0.000   REJECT H_0
There are several other variables that control the test. To replace u1 and u2 with their test names, (e.g., u1 would be replaced with grep:reboot.res, pass --set verbosettest=1. The confidence level can be adjusted with --set confidencelevel. To determine if two samples are different by a given delta use --set twosampledelta=delta.
Finally, if you want to compare each sample to every other sample in a pair-wise manner pass --pairwiset instead of --twosamplet.
TEST DirectivesAuto-pilot can run an arbitrary program to determine if a given benchmark requires more iterations. If the program returns true (zero), then the benchmark is complete, otherwise more iterations are required.
Getstats supports a predicate mode specifically designed to evaluate these conditions. For each quantity (e.g., Elapsed time) that is measured the predicate is evaluated independently. If the predicate is false for any of the quantities, then Getstats returns false (non-zero).
To evaluate a predicate Getstats performs replacement, and then executes
Perl's eval function on the string. The primary replacements that we
use are $name, $mean, and $delta (i.e., the half-width
of a 95% confidence interval).
For example, the following Getstats command ensures that the User,
System, and Elapsed have half-widths that are less than 5% of the mean,
and no test may run more than 30 times: getstats --predicate
'("$name" ne "User" && "$name" ne "System" && "$name" ne "Elapsed") ||
("$delta" < 0.05 * $mean) || ($count > 30)".
See Replacements, for detailed information about available replacements.
Getstats defines 21 basic transformations, 11 library functions that are composed of these transformations, and 8 library functions that are Perl snippets. This chapter describes Getstats internals, and each of the transformations, and functions that Getstats provides. We assume you have already read Getstats.
There are a few things that you should know to start off:
The older version was 762 lines long, and had 20 command line parameters, but all of them were ad-hoc, and extending Getstats for another field was difficult. The new version is 1805 lines long, but has very little built in.
That being said if you do not know Perl, there are enough predefined things there so that you do not need to worry.
To get Getstats to do really cool stuff (e.g., more statistical tests) you might need to know the internals, that is why things like variable names are included in this document.
The basic transformations can be divided into four categories: project, select, control, and output. The control and output transformations aren't quite transformations like project and select, but that is what we'll call them for consistency.
Throughout this section of the document, transformations are denoted as if they were functions, but in reality they are Perl arrays. This presentation allows the concepts to be discussed, without the complication of Perl syntax. See TransInt, for information on how to manipulate them.
The project transformations include remove, rename, add, and move. The project transformations operate on the labels and rows individually to produce a new relation. The new relation replaces the old relation.
removeIf the current relation is Relation 7.1, and the transform remove("thread") yields rel2.
renameaddmoveIf we use Relation 7.1 as our starting point, move(thread,0) yields rel5:
update add_col("temporary_name", expression)
remove("foo")
rename_col("temporary_name", "foo")
The update operation, however, does not reorder the columns and is done in a single pass through the relation.
The select transformations pick items that meet a given condition from a relation. Once the items are selected, further processing may be done. There are three types of select transformations: basic, warning, and aggregate.
selectOften, the first run of a test is faster than the other runs because it warms the cache (e.g., it uses a compiler on the root partition). To throw out this test, you could select("$epoch > 1"). Performed on Relation 7.1, this yields rel6.
warn"warn" operates much like select, except it takes two arguments. The first is a predicate that raises the warning, and the second is an error message. If a warning is raised, then the global variable "wraised" is incremented.
The first argument undergoes replacement, and then is passed to Perl's eval function. If it evaluates to true, then the second argument undergoes replacement and is printed on standard error. "warn" is most useful when combined with "foreachrow" or "foreachcol" (See Control Transformations). There are three library functions that make use of warn in this way: "warnrow", "warncol", and "warnval."
aggregateAggregate becomes much more useful when combined with the "group" control transformation (See Control Transformations).
blockifexistAn example of an ifexist transformation is:
ifexist("pdiff", update("pdiff", "$pdiff - $sys - $user"))
This transformation sets pdiff to the CPU time used by everything, except
the test, but does not fail if pdiff doesn't exist.
ifevalnoopforeachcolforeachrowgroupThe group transformation starts by partitioning the current relation into a set of new relations, such that each unique value of key produces a new relation and all the elements in that relation have the same value of key.
For example, grouping rel9 on epoch creates rel10a, rel10b and rel10c.
The second argument to group is a transformation that is run on each of the new relations individually. A typical example of this transformation would be the aggregate transformation.
Assume we ran remove(thread) on each relation, we would have three new relations. For example, Relation 7.8 would be come:
We could then use the following aggregate transformation:
          aggregate({
          "elapsed" = "$max",
          "cpu" = "$sum",
          "epoch" = "$mean",
          })
Note that because epoch is the key we grouped by we can use mean to get the single value of epoch.
Running this transformation on Relation 7.11 would yield rel11.
This transformation is repeated on Relation 7.9 and Relation 7.10, and finally the results are concatenated, yielding rel12:
Relation 7.13 is the final output of this example group command.
The output transformations are echo, die, csv, and describe.
echodieecho and die take an arbitrary number of arguments, perform global
replacement on them, and then print the result. Die uses Perl's die command to
print the result on stderr and execution halts.
csvdescribedescribe(["NAME", "MEAN"]); when applied to descrel
prints out the following table:
          NAME     MEAN
          fruzzles   16
          widgets     3
The value of each part of the table is determined by performing column
replacement on the variable $globals{'colexpr'}->{$colname}.
For more information on replacement, See Replacements. This gives
you quite a bit of power when deciding what to print.
There are three other global parameters that control the describe output: spacing, delimiter, and precision. spacing determines the number of spaces between each column. If set to zero, there are no spaces between each column (e.g., fruzzles16). If delimiter is set, then it is printed between each column. For example, if delimiter is , and spacing is zero, the first row would be fruzzles,16. The final value of interest is precision, which specifies how many digits after the decimal point are printed for floating point values.
The set transformation can be used to set spacing, delimiter, and precision.
To set values in the colexpr hash, you should use "eval" to modify individual
elements or "seteval" to replace the whole hash.
dumpThe default function library can be broken down into several categories: manipulating global variables, time related functions, warning primitives, built-in warnings, the default transformations that each relation undergoes, predicate evaluation, and relation renaming.
There are several functions that manipulate global replacement variables (which are stored in %globals).
set(var, val)setexpr(var, expr)seteval(var, expr)setexpr performs global replacement first, and seteval first runs
Perl's eval function on expr.
unset(var)push(var, val)pusheval(var, expr)pusheval, "expr" is first passed through
Perl's eval function.
pop(var)There are also several transformation functions for creating more useful output from times.
aggthreadsprocdiffsavestats$globals{'stathashes'}, this is used for computing overheads.
unifycommandconfigure and
make).
There are three types of warning primitives. Warnings that should be evaluated for each row ("warnrow"), column ("warncol"), or each cell ("warnval").
warnrow(expression, output)Assuming that the exist status is stored in a column named status, the following transformation warns when tests fail:
          warnrow("$status != 0",
          	"Failure for epoch $epoch, thread $thread, exit status = $status.")
When run on Relation 7.15, the output is:
Failure for epoch 3, thread 1, exit status = 127.
warncol(expression, output)An example column warning would be if the half-width of a confidence interval is greater than 10% of the mean:
warncol("$delta > $mean * 0.05", "$name has a half-width of $delta.")
warnval(expression, output)The following transformations use the previously described warning primitives to raise warnings if $warn is set (which it is by default). You can turn these warnings off by setting $warn to 0.
exitfailnegiootherexec You can control the percentage by setting the global variable
otherexec-thresh.
warnregress You can control the slope by setting the global variable regress-thresh.
zscoreYou can control the zscore by setting the global variable zscore-thresh.
The following functions define the four default passes that getstats performs over the relations. Any transformations specified on the command line are executed after readpass, but before warnpass.
readpasswarnpassohpasssummarypredicate(expr)Predicate takes a single argument, which is the predicate to evaluate over each column of data. If the predicate is not true for any of the columns, Getstats dies. Auto-pilot picks up on this failure and continues to run the tests.
twosampletIt also performs a two-sample t-test with a null hypotheses of "current mean - baseline mean <= twosampledelta", "current mean - baseline mean >= twosampledelta", and "current mean - baseline mean = twosampledelta". The p-value (the probability of observing this data, assuming the null hypothesis is true). If the p-value is small, then you can reject the null hypothesis. "REJECT" or "ACCEPT" is also printed, based on the confidence level you have specified (95% by default).
The following example compares a one threaded Postmark run (Sample 1) against a two threaded postmark run (the baseline is Sample 2).
          Comparing samples/ext2:2.res (Sample 1) to samples/ext2:1.res (Sample 2).
          Elapsed: 95%CI for samples/ext2:2.res - samples/ext2:1.res = (7.945, 8.029)
          H_0: u1 - u2 <= 0.000  H_a: u1 - u2 >  0.000  P = 1.000  ACCEPT H_0
          H_0: u1 - u2 >= 0.000  H_a: u1 - u2 <  0.000  P = 0.000  REJECT H_0
          H_0: u1 - u2 == 0.000  H_a: u1 - u2 != 0.000  P = 0.000  REJECT H_0
As we can see, we must accept the assumption that two threads takes less time than one thread. We can reject the assumption that two threads takes longer than one thread, and the assumption that they take the same amount of time. Remember that Getstats runs all of these tests, but you need to choose which assumption makes sense for your case. For example, if you have code that should improve performance, you can't make the assumption that it does improve performance. Instead, you must make the assumption that it does not improve performance, and either accept or reject that conclusion.
Several global variables control the ttest. ttestcolumns is a comma separate list of columns to compare. twosampledelta controls the delta for the t-test, by default the delta is zero. This is used to show that two samples are different by more than some value. rejectonly causes only rejected hypothesis to be displayed, this can greatly reduce the amount of output when comparing mostly similar samples. verbosettest prints the relation names instead of u1 and u2. confidencelevel controls when to reject or accept tests (and the width of the confidence interval). precision controls how many decimal places are printed.
pairwisetrename_relation(expr)basenameThroughout Getstats its behavior is controlled by replacing internal variables with the actual values that are taken from the current relation and an environment. Depending on the current context, there are four types of replacement: Global, Row, Column, and Value.
Within a string that undergoes replacement, variables are denoted by
$var, where var is the name of a variable. For example, in
the string 1 + $val, if val is defined as 2, the string
becomes 1 + 2. If val is not defined, no replacement
occurs.
Because these replacements are often passed to Perl's eval function, invalid variables are be caught by Perl. If the string is not evaluated by Perl, then it is output, and the user sees that no substitution took place.
Getstats uses a hash, %globals, to maintain a global environment. Any
variable that is defined in %globals is replaced under Global
replacement.
When evaluating two related expressions, Getstats declares the Perl hash
%ptemp. If a variable is defined in %ptemp, it is also
replaced under Global replacement. For more information See Temporary Variables.
Getstats defines several global variables automatically:
filefilenofilecountThe following global variables are set or used by Getstats default library:
confidenceleveldelimiterspacingprecisionwraisedThe global variables colexpr, stathashes, outcols, agg_commands, and agg_threads are complex types. To modify or read them them more knowledge is required, and you should look in the corresponding manual section.
Using the current row in the relation as its context, $fieldname, is replaced by the value of the field named fieldname.
Row replacement implies global replacement.
Column replacement operates on a column of the current relation, and supports three distinct types of variables: internals, PointEstimation, and LineFit.
The following getstats internal variables are supported:
$nameFrom Statistics::PointEstimation (perldoc Statistics::PointEstimation):
$mean$median$stdev$variance$min$max$sum$count$mode$delta$globals{confidencelevel}.
From Statistics::LineFit (perldoc Statistics::LineFit):
$slope$intercept$lr-rSquared$lr-durbinWatson$lr-meanSqError$lr-sigmaColumn replacement implies global replacement.
Value replacement occurs in the special case that both row and column replacement are performed simultaneously. Value replacement takes place in the context of a single cell within a relation.
$valEach pair of evaluated expression in getstats has access to a hash named "ptemp", which can be used for temporary private variables. When used with warnings, the expression can set values in ptemp that the warning text uses.
This is used in zscore warnings:
     warnval(
       "if($stdev) {$ptemp{'zscore'} =
         eval \"(abs($mean - $val) / $stdev)\";
         return (($globals{'zscore-thresh'} > 0)
         && $ptemp{'zscore'} > $globals{'zscore-thresh'}); }",
       "High z-score of \$zscore for \$name in epoch \$epoch."
     )
The variable $ptemp{'zscore'} is set to eval of (abs($mean -
$val) / $stdev), and if it is higher than the global variable zscore-thresh,
the warning is raised. The warning text reference $zscore, which is
picked up from %ptemp.
Notice that eval is used within the predicate, because the standard deviation
may be zero. Before the string is evaluated, $stdev could be replaced
with zero, and if Perl sees a division by the constant zero it causes an
error – even if that part of the expression is never evaluated. By using
nested evals, we delay parsing of that expression until we have checked that
$stdev is not zero.
Each transformation is represented as a Perl array. The first element is a
command that defines the transformation. For example ["noop"] is a no-op
transformation. The remaining fields of the array are arguments. For example,
["echo", "Hello,", "world."] is an echo transformation that prints
Hello, world.. The arguments need not be strings, for example
block is a list of further transformations:
     ["block",
     	["echo", "Mary had a little lamb,"],
     	["echo", "whose fleece was white as snow."],
     	["echo", "And everywhere that Mary went,"],
     	["echo", "the lamb was sure to go."],
     ]
Other transformations take other types of arguments (e.g., aggregate takes a hash).
The command must be one of the 20 basic transformations described in this
document, or a function defined in the %functions hash.
The functions hash maps commands to either a transformation (most likely a block of them), or Perl subroutines.
An example of function that is a block of transformations is "pdiff", which converts the "pdiff" column from the total number of seconds of CPU time used by every process on the system, into the percentage of CPU time used by non-measured processes.
     "procdiff" => ["ifexist", "procdiff",
     ["block",
             ["update", "procdiff",
               "if (\$procdiff) {
                return 100.0 *
                  eval(\"(\$procdiff - \$user - \$sys) / (\$procdiff)\")
               } else {
                return 0;
               }"],
             ["otherexec"],
             ["rename", "procdiff", "Excess CPU%"],
     ],
     [ "noop"]]
Notice that eval is used within the predicate, because pdiff may be zero.
Before the string is evaluated, $pdiff could be replaced with zero, and
if Perl sees a division by the constant zero it causes an error – even if
that part of the expression is never evaluated. By using nested evals, we
delay parsing of that expression until we have checked that $pdiff is
not zero.
An example of a function that is a Perl subroutine is "set", which sets a variable that can be used for global replacement.
Set is invoked as ["set", "warn", "0"] (which sets the global replacement variable $warn to 0).
     "set" => sub {
     # The arguments to the function are the transformation itself
     # and the current relation that we are operating on.
     	my ($tref, $aref) = @_;
     # Make sure that we get the right number of arguments
             if ($#$tref > 2 || $#$tref <= 0) {
                     die "set takes only one or two argument.";
     } else {
     # Then do the bit of perl that we wanted.
                     if ($#$tref == 1) {
                             $globals{${$tref}[1]} = 1;
                     } else {
                             $globals{${$tref}[1]} = ${$tref}[2];
                     }
             }
     },
Because you can use arbitrarily complex functions, Getstats is arbitrarily extensible.
All Getstats arguments start with a double dash, and a – terminates option processing. All other arguments are files to parse.
Getstats natively implements the following options:
If this option is specified, getstats reads in each individual results file,
then creates a larger relation. To concatenate two (or more) relations they
must have exactly the same columns.
"readpass" is executed before any other transforms on the command line. "warnpass", "ohpass" and "summary" are executed after other transforms.
The following options are executed before any transforms
@TRANSFORMS, or
whatever your heart desires (and Perl lets you do).
The following options add a transform
Any other option that is treated as a getstats transformation (e.g., "–foo") calls the Getstats transformation foo after "readpass". If you want to run the transformation before "readpass" specify –shift before the transform (e.g., –shift –select '"\$command" eq "./configure"').
Not all built-in transformations are supported, specifically the control transformations "if", "ifexist", "block", and "group" are not supported (essentially anything that requires another transformation as its argument).
All library functions, and other built-in transformations are supported.
If you use a function that takes many arguments, like describe then you must terminate the arguments with – or another option. If you don't terminate it then Getstats assumes your file names are input to that transform.
Getstats knows the number of arguments for the following transformations, if you define your own, then Getstats assumes it has many arguments.
| Transforms with no arguments | csv, savestats, exitfail, aggthreads, unifycommand, negio,
otherexec, warnregress, pdiff, zscore, ohpass, readpass, summary, warnpass
|
| Transforms with 1 argument | remove, select, eval, pop, predicate
|
| Transforms with 2 arguments | add, warnrow, warncol, warnval, update, rename, move
|
| Transforms with many arguments | describe, noop, echo, die
|
Getstats itself does not include any parsers, instead it searches the
Perl @INC array which contains possible include paths for files
of the pattern gs_parser_*, and includes them. Getstats includes
three parsers by default, one for Auto-pilot results files, one for CSV
files, and one for a sequence of GNU time outputs. To add your own
parser, you should simply copy one of these parsers and modify it to
suit your needs.
Each parser defines two functions, and three parameters:
Graphit is a Perl script that generates both line and bar graphs using Gnuplot 3.8j or higher. Graphit automatically processes Getstats output, results files (by executing Getstats), and CSV files. Each input file is treated as a series, and has several components. To properly read this section, you should use the Postscript viewer (or HTML), as info may not correctly display images.
In a bar graph, each series creates a group of bars. In fig:bargraph, the series are Ext2, Ext3, and Reiserfs. Each component becomes a bar in each series. In fig:bargraph, the components are Elapsed, System, and User.
Figure 8.1: A bar graph with three series (Ext2, Ext3, and Reiserfs) and three components (Elapsed, System, and User).
In a line graph, a line is created for the cross product of the series and components. In fig:linegraph, there are two components and series. The components are Elapsed and System, and the series are Ext3 and Reiserfs. Of special note is that this line graph actually has more points than the corresponding bar graph even though it has fewer series and components. This is because each series-component combination in a line graph can have any number of points (in this case six), but a series-component combination only has a single point in a bar graph. Another important distinction between line and bar graphs is that bar graphs use an artificial x-axis, but a line graph uses an x-axis based on an actual quantity (for example, the number of threads).
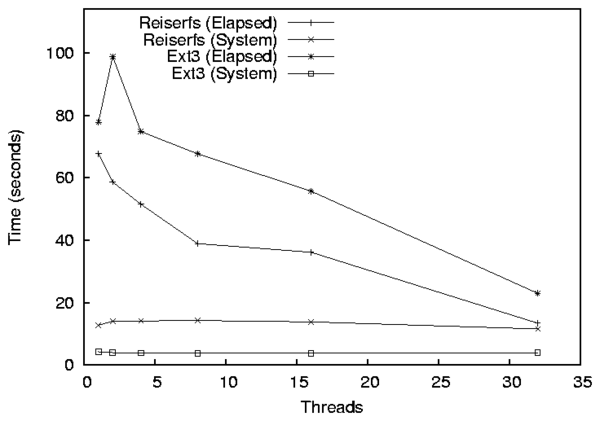
Figure 8.2: A line graph with two components (Elapsed and System) and two series (Ext3 and Reiserfs). Each series-component combination has six points.
Graphit has three required options as follows:
bar|lineAfter the options, Graphit takes an even number of arguments, which are pairs that define the graph's series. The first element of the pair is the series name (e.g., Ext2). The second element is the input that defines the series. The input specification is parser specific.
To create a bar graph using Getstats output the input specification is a file name. The file can either be a the output from a single run of Getstats (the tabular report, without the warnings), or an Auto-pilot results file. If an Auto-pilot results file is specified, then Getstats is executed using the command getstats --set warn=0 file, to create a corresponding tabular report.
When you specify the output of Getstats, Auto-pilot only handles files that contain a single result. To handle files with more than one result, then you must use the syntax file@index, where file is the name of the file and index is the name of the sample within the file. For example in the following file named summary:
samples/ext2:1.res
NAME    COUNT MEAN   MEDIAN LOW    HIGH   MIN    MAX    SDEV%  HW%
Elapsed 10    8.168  8.154  8.131  8.205  8.112  8.271  0.633  0.453
System  10    0.140  0.135  0.119  0.161  0.100  0.190  20.757 14.849
User    10    0.021  0.020  0.011  0.031  0      0.040  65.253 46.680
Wait    10    8.007  7.987  7.967  8.047  7.957  8.131  0.697  0.498
CPU%    10    1.971  1.786  1.669  2.272  1.466  2.690  21.413 15.318

samples/ext2:2.res
NAME    COUNT MEAN   MEDIAN LOW    HIGH   MIN    MAX    SDEV%  HW%    O/H
Elapsed 10    16.155 16.142 16.129 16.182 16.131 16.252 0.229  0.164  97.780
System  10    0.292  0.280  0.238  0.346  0.170  0.430  25.770 18.435 108.571
User    10    0.029  0.030  0.019  0.039  0.010  0.050  47.252 33.803 38.095
Wait    10    15.834 15.846 15.779 15.890 15.709 15.936 0.489  0.350  97.747
CPU%    10    1.987  1.891  1.644  2.330  1.301  2.905  24.142 17.271 0.820
There are two possible index values: samples/ext2:1.res and samples/ext2:2.res. To specify the first set, you would use summary@samples/ext2:1.res. Correspondingly the second set is summary@samples/ext2:2.res.
To create a line graph using Getstats output the input specification is
a set of files using a shell globbing pattern. By default, the files'
common prefix and suffix are removed to determine the x-axis position
for a given file. For example, ext2:1.res and ext2:2.res
have a common prefix of ext2: and a common suffix of .res,
therefore ext2:1.res is located at 1 on the x-axis and
ext2:2.res is located at position 2 on the x-axis.
You must specify the globbing pattern, not the files on the Graphit
command line, so it must be quoted (e.g., graphit [options] Ext2
'ext2:*.res'), so that the shell does not expand the glob.
Sometimes the common prefix is too large. For example,
test:100.res and test:1000.res have a common prefix of
test:100, and a common prefix of .res. In these cases you
must manually specify the prefix and suffix. To pass arguments to a
parser use the --Xparser option. For example, graphit
[options] --Xparser='--prefix=test:' --Xparser='--suffix=.res' Test
'test:*.res'.
If you specify incorrect --Xparser options, the parsers do not
issue warnings or errors, because each parser has access to all parser
options, and the valid options are different for different parsers.
To specify files with multiple results, the syntax is similar to bar graphs, but you can use file globs both for the summary and index. If an index is used, then the index is computed before globbing is applied. Therefore, * matches all files, but no indexes. The pattern *@*, matches all files and all indexes.
A single CSV files can represent multiple series and components. For a
bar graph, the columns are the components, and each row (line) is a
series. The input specification is a single CSV file, but the series
specification is special: it is a regular expression that matches the
x-value in the CSV file. For bar graphs, each x-value becomes a set of
bars.
For example, if you have a CSV file with the x-value column
"Filesystem", you use the regular expression Ext. to graph only
Ext2 and Ext3.
If not all components in the CSV file are being graphed, it is not clear
what the x-value should be (if all of the other components are being
graphed, the only remaining one is used as an x-value). To specify the
column for the x-value, use the --xcol parser argument as
follows graphit [options] --Xparser='--xcol=Column'.
For a line graph, the CSV uses a normal series specification (not a regular expression), and the input specification is a single file. Each column is a component (or used to determine the x-value). If all columns except one are used for the components, then the remaining column is automatically selected for the x-value. The --xcol parser option is used to select the column for the x-value, which must be numeric. Each row represents a single position along the x-axis.
Figure 8.1 shows a simple bar graph with three components and three series (sets of bars). To create this graph, the following command was used:
     graphit --mode=bar --graphfile=pm.eps \
             --components=Elapsed,User,System \
             -f 20 \
             --ylabel "Time (seconds)" \
             'Ext2' ext2/ext2:1.res \
             'Ext3' ext3/ext3:1.res \
             'Reiserfs' reiserfs/reiserfs:1.res
The first line informs graphit that we are creating a bar graph that should be output to pm.eps. The second line indicates that each set of bars, should have Elapsed, User, and System time components. The third line increases the font size to 20 points. The fourth line sets the y-axis label to Time (seconds). Lines 5–7 define the series. Ext2 is taken directly from the results file ext2/ext2:1.res, Ext3 is taken from ext3/ext3:1.res, etc.
Bar graphs can also be generated from CSV files. fig:revenue-nostack is a bar graph generated from the following CSV file containing revenue (in Millions of US dollars) for AMD and Intel:
     Year,AMD,Intel
     1995,2468,16202
     1996,1953,20847
     1997,2356,25070
     1998,2542,26273
     1999,2857,29389
     2000,4644,33726
     2001,3891,26539
     2002,2697,26764
     2003,3519,30141
     2004,5001,34209
The command line to generate this graph was:
     graphit --mode=bar --graphfile=revenue.eps \
             --ylabel "Revenue (Millions USD)" -f 20 \
             --components=AMD,Intel \
             '[0-9]*' revenue.csv
The components map to the columns in the CSV file, and Year was
automatically selected for the Series names because there were no other
columns. All of the values in the CSV file were selected, because the
regular expression '[0-9]*' matches all of the years. To graph the only
revenue for 1999-2004, you could use regular expression
(1999|2.*) instead.
Stacked bars are displayed such that the bottom of bar starts at
the top of another bar. In Figure 8.1, User time is stacked on
System time. By default User is stacked over System, but no other bars
are stacked. To disable stacking you can use the --nostack
option. To stack two components specify --stack
Top/Bottom on the Graphit command line.
For example, lets assume we did not want to stack the values in Figure 8.1. We could use a command line like the following:
     graphit --mode=bar --graphfile=pm.eps \
             --components=Elapsed,User,System \
             -f 20 --ylabel "Time (seconds)" \
             --nostack --bargap 0.25 \
             'Ext2' ext2-1/ext2:1.res \
             'Ext3' ext3-2/ext3:1.res \
             'Reiserfs' reiserfs-1/reiserfs:1.res
The only differences with the previous graph are the addition of the --nostack option, and the --bargap 0.25 option. The --bargap option is used to spread the individual bars out. If we did not spread out the bars, then it would be possible for System time to completely cover User time (or vice versa). We specified 0.25 as the gap between bars, because each bar is 0.25 artificial x-units large by default (the default spacing is 0, so each bar in the group lines up precisely with the other bars). The graph produced by this command is shown in fig:nostack.
Figure 8.5 is the same graph as Figure 8.3, but AMD's revenue is stacked on top of Intel's. This type of graph is a better depiction about the total revenue for both companies, because we can visually see the revenue changes, without needing to add them in our head. The labels above each bar on this graph are the total revenue for both AMD and Intel.
The simplest way to create a line graph is to create one based on several results files, like Figure 8.2. To generate this graph, the following command was used:
     graphit --mode=line --graphfile=pm-line.eps \
             --components=Elapsed,System -f 20 \
             --ylabel "Time (seconds)" \
             --xlabel "Threads" \
             Reiserfs 'reiserfs/reiserfs:*.res'\
             Ext3 'ext3/ext3:*.res'
This is rather similar to the command to generate line graphs, but the --mode option is set to line, and instead of a single input file, the input specification specifies a shell globbing pattern. In this case the Reiserfs glob is expanded to reiserfs/reiserfs:1.res, reiserfs/reiserfs:2.res, reiserfs/reiserfs:4.res, reiserfs/reiserfs:8.res, reiserfs/reiserfs:16.res, and reiserfs/reiserfs:32.res. Because reiserfs/reiserfs: is a common prefix, and .res is a common suffix, they are stripped and the x-values are 1, 2, 4, 8, 16, and 32 for each file, respectively.
Line graphs can also be generated from a CSV file. Assume that you have a program that gets faster or slower as it runs. A natural way to show this progression is using a line graph. If you have run the program through Auto-pilot you have a .res file that contains the time for each execution, but you can not directly use it for graphing because Graphit produces one point for a standard results file.
We can use getstats to convert a results file into a CSV file using the following command:
     getstats --nostdtransforms --readpass \
             --rename elapsed Elapsed \
              --rename user User \
             --rename sys System \
             --csv find.res >find.csv
This command skips the standard transformations, performs the
readpass transformation, renames the columns, and produces a
CSV file on stdout, which is redirected to find.csv.
find.csv contains lines like the following
     "epoch","Elapsed","User","System","io","cpu"
     "1","8.231657","0.917859","7.313887","-8.90000000000057e-05","100.001081191794"
     "2","8.647","0.968851","7.264894","0.413255","95.2208280328438"
     ...
Using find.csv, we can generate a graph using the following command:
     graphit --mode=line  --graphfile find.eps \
             --components=Elapsed,User,System
             --xlabel "Run number" --ylabel "Time (seconds)" \
             -Y 10 \
             --Xparser=--xcol=epoch \
             'Find' find.csv
In this example, there are two new options that we used: -Y and
--Xparser. Adding -Y 10 increases the maximum value on
the y-axis to 10, so that the key does not overlap the lines. The
--Xparser=--xcol=epoch option is used to select the column
within the CSV file that is used for X values. We must specify the
--xcol parser option, because there are three possible
candidates (epoch, io, and cpu).
Graphit parsers work much like the Getstats parsers described in Getstats Parsers.
Graphit itself does not include any parsers, instead it searches the
Perl @INC array which contains possible include paths for files
of the pattern gi_parser_*, and includes them. Graphit two
parsers by default, one for Getstats output and Auto-pilot results
files, and another for CSV files. To add your own parser, you should
simply copy one of these parsers and modify it to suit your needs.
Each parser defines two functions, and three parameters:
@seriesdata array. The third is the name of the series, and
the fourth is the input specification. The parsing function can assume
that the input specification is correct, because the detection function
has already returned true.
The series data array contains references to hashes that define a
series. To see the value of the @seriesdata array after
parsing, pass the -d option to Graphit. Each hash contains a
"name" key that is the name of the series. The rest of the keys in the
top-level hash are a position along the x-axis for line graphs. For bar
graphs, the only other key is "0". Each of these keys contains a
sub-hash, that is indexed by each component. These sub-hashes, in turn
contain a sub-sub-hash that has three keys: high, low, and
mean. These keys map to integers for the top and bottom value of
the error bar and the y-value for that x position (or bar).
The @seriesdata array for Figure 8.1, is as follows:
     @seriesdata = [
               {
                 '0' => {
                          'System' => {
                                        'high' => '2.807',
                                        'low' => '2.709',
                                        'mean' => '2.758'
                                      },
                          'User' => {
                                      'high' => '1.735',
                                      'low' => '1.615',
                                      'mean' => '1.675'
                                    },
                          'Elapsed' => {
                                         'high' => '6.120',
                                         'low' => '5.991',
                                         'mean' => '6.055'
                                       }
                        },
                 'name' => 'Ext2'
               },
               {
                 '0' => {
                          'System' => {
                                        'high' => '4.327',
                                        'low' => '4.217',
                                        'mean' => '4.272'
                                      },
                          'User' => {
                                      'high' => '1.877',
                                      'low' => '1.773',
                                      'mean' => '1.825'
                                    },
                          'Elapsed' => {
                                         'high' => '81.567',
                                         'low' => '74.156',
                                         'mean' => '77.861'
                                       }
                        },
                 'name' => 'Ext3'
               },
               {
                 '0' => {
                          'System' => {
                                        'high' => '12.944',
                                        'low' => '12.632',
                                        'mean' => '12.788'
                                      },
                          'User' => {
                                      'high' => '2.087',
                                      'low' => '1.907',
                                      'mean' => '1.997'
                                    },
                          'Elapsed' => {
                                         'high' => '69.842',
                                         'low' => '65.597',
                                         'mean' => '67.719'
                                       }
                        },
                 'name' => 'Reiserfs'
               }
     ];
Parsers may need to process command line arguments, which are specified with the --Xparser command line option. To access the arguments, a parser can access @PARSERARGV, but should not modify it. Also, if an argument is unknown the parser should not fail or exit the program, because the argument could be for another parser.
Joseph Spadavecchia developed the first simple version of our benchmarking Perl script that has since morphed into the current Auto-pilot.
Yevgeniy Miretskiy wrote the bar graphing tool that our unified bar/line graphing tool is based on. His Perl expertise was also invaluable when designing and implementing the rest of the system.
Amit Purohit, Kiran-Kumar Muniswamy-Reddy, Michael Martino, Akshat Aranya, Nikolai Joukov, Devaki Kulkarni, and others in our lab have provided valuable feedback when using the system to benchmark their projects. Avishay Traeger is the King of finding Auto-pilot bugs, and stretching the system to its limit, without him it would be in much worse shape.
This work was partially made possible by an NSF CAREER award EIA-0133589, NSF Trusted Computing Award CCR-0310493, and HP/Intel gifts numbers 87128 and 88415.1.
add: Project Transformationsaggregate: Select Transformationsaggthreads: Default Function Libraryap_action: Scriptsap_hook: Scriptsap_initfs: File System Scriptsap_log: Scriptsap_logexec: Scriptsap_measure: Scriptsap_requirehook: Scriptsap_snap: Scriptsap_unmount: File System Scriptsap_unmount: Scriptsbar graph layout: Graphit Optionsbasename: Default Function Libraryblock: Control Transformationsbufferwidth: Graphit Optionscatfiles: Command line argumentsCHECKPOINT: Directive ReferenceCLEANUP: Directive Referencecomponents: Graphit Optionscsv: Graphit Usage Examplescsv: Output Transformationscsv: CSV Resultsdatfile: Graphit Optionsdescribe: Output Transformationsdie: Output Transformationsdump: Output Transformationsdump: CSV Resultsecho: Output TransformationsECHO: Directive ReferenceELSE: Directive ReferenceELSE IF: Directive ReferenceENV: Directive ReferenceENVEX: Directive Referenceerrorbars: Graphit Optionseval: Control TransformationsEVAL: Directive ReferenceEXEC: Directive Referenceexitfail: Default Function LibraryFASTFAIL: Directive Referencefiletype: Graphit OptionsFOR: Directive ReferenceFOREACH: Directive Referenceforeachcol: Control Transformationsforeachrow: Control Transformationsgpfile: Graphit Optionsgraphfile: Graphit Optionsgroup: Control Transformationsgroupgap: Graphit Optionsif: Control TransformationsIF: Directive Referenceifexist: Control TransformationsINCLUDE: Directive ReferenceINCLUDEPATH: Directive Referencekey: Graphit OptionsLOGS: Directive Referencemode: Graphit Optionsmove: Project Transformationsnegio: Default Function Librarynocatfiles: Command line argumentsnoerrorbars: Graphit Optionsnoop: Control Transformationsnostack: Graphit Optionsnostdtransforms: Command line argumentsoffsets: Graphit Optionsohpass: Default Function LibraryOPTINCLUDE: Directive Referenceotherexec: Default Function Librarypairwiset: Default Function Librarypairwiset: Hypothesis Testingpop: Default Function LibraryPOSTCLEANUP: Directive ReferencePRESETUP: Directive Referenceprocdiff: Default Function Librarypush: Default Function Librarypusheval: Default Function LibraryQUIET: Directive Referencereadpass: Graphit Usage Examplesreadpass: Default Function Libraryremove: Project Transformationsrename: Graphit Usage Examplesrename: Project Transformationsrename_relation: Default Function LibraryRESULTS: Directive Referencerotate: Graphit Optionssavestats: Default Function Libraryselect: Select Transformationsset: Default Function Libraryset: Tabular Reportsseteval: Default Function Librarysetexpr: Default Function LibrarySETUP: Directive Referenceshiftform: Command line argumentssize: Graphit Optionsstack: Graphit Optionsstartoffset: Graphit Optionsstdtransforms: Command line argumentsSTOP: Directive Referencestyle: Graphit Optionssummary: Global Replacementsummary: Default Function LibrarySYSTEM: Directive ReferenceTEST: Directive ReferenceTEST, predicates: Predicate EvaluationTHREADS: Directive Referencetitle: Graphit Optionstwosamplet: Default Function Librarytwosamplet: Hypothesis Testingunifycommand: Default Function Libraryunset: Default Function Libraryupdate: Project TransformationsVAR: Directive ReferenceVAREX: Directive Referencewarn: Select Transformationswarncol: Default Function Librarywarnpass: Default Function Librarywarnregress: Default Function Librarywarnrow: Default Function Librarywarnval: Temporary Variableswarnval: Default Function LibraryWHILE: Directive Referencexlabel: Graphit OptionsXparser: Graphit ParsersXparser: Graphit Optionsylabel: Graphit Optionszscore: Default Function Library@seriesdata: Graphit ParsersAPEPOCH: ScriptsAPIPCKEY: PostmarkAPIPCKEY: Directive ReferenceAPLOG: ScriptsAPMODE: ScriptsAPTHREAD: ScriptsAPTHREAD: Directive ReferenceAPTIMER: ScriptsBLOCKSIZE: jfsBLOCKSIZE: ScriptsBUFFERING: PostmarkCOMPILE: Compile BenchmarksCOMPILECMD: Compile Benchmarksconfidencelevel: Global Replacementconfidencelevel: Hypothesis Testingconfidencelevel: Tabular Reportscount: Column ReplacementCREATEBIAS: PostmarkDATADIR: Compile BenchmarksDELETE: Compile Benchmarksdelimiter: Global Replacementdelta: Column ReplacementDOMOUNT: File System ScriptsFAILADDR: Configuration Examplefile: Global Replacementfilecount: Global Replacementfileno: Global ReplacementFORMAT: File System ScriptsFORMAT: Configuration ExampleFSSIZE: jfsFSSIZE: File System ScriptsHTREE: htreeINITFILES: Postmarkintercept: Column ReplacementLOWERFS: stackableLOWERROOT: stackablelr-durbinWatson: Column Replacementlr-meanSqError: Column Replacementlr-rSquared: Column Replacementlr-sigma: Column Replacementmax: Column ReplacementMAXSIZE: Postmarkmean: Column ReplacementMEASURE_MEMINFO: meminfoMEASURE_PARTDIFF: partdiffMEASURE_PROCDIFF: procdiffmedian: Column Replacementmin: Column ReplacementMINSIZE: PostmarkMODDIR: stackablemode: Column ReplacementMYINITFILES: PostmarkMYSUBDIRS: PostmarkMYTRANSACTIONS: PostmarkNETUTILIF: netutilizationOKADDR: Configuration ExamplePACKAGE: Compile BenchmarksPAGEADDR: Configuration ExamplePARTDIFF_LIST: partdiffPKGFILE: Compile BenchmarksPOSTMARKDIR: Postmarkprecision: Global ReplacementPROCDIFF_PROCS: procdiffPROCDIFF_THRESHOLD: procdiffREADBIAS: PostmarkREADSIZE: Postmarkrejectonly: Hypothesis TestingREMOTEPROCDIFF: remoteprocdiffRESTORE: Directive ReferenceRPDIFFSERVER: remoteprocdiffRPDIFFUSER: remoteprocdiffSEED: Postmarkslope: Column Replacementspacing: Global ReplacementSTACKFS: stackablestdev: Column Replacementsum: Column ReplacementTESTDEV: File System ScriptsTESTDEV: Configuration ExampleTESTDIR: File System ScriptsTESTDIR: ScriptsTESTROOT: File System ScriptsTESTROOT: ScriptsTESTROOT: Configuration ExampleTHREADS: PostmarkTHREADS: ScriptsTHREADS: Directive ReferenceTRANSACTIONS: PostmarkUNTAR: Compile Benchmarksval: Value Replacementvariance: Column Replacementverbosettest: Hypothesis Testingwarn: Hypothesis Testingwraised: Global ReplacementWRITESIZE: Postmarkapremote.sh: remoteprocdiffaptime: Scriptsaptime.sh: Custom Scriptscommonfunctions: Scriptscompile.sh: Compile Benchmarksgetstats: Graphit Usage Examplesgetstats: Getstatsgraphit: Graphitpostmark.sh: Postmarksemdec: Postmarksemdec: Directive Reference